
d3 Ethnicity Graph
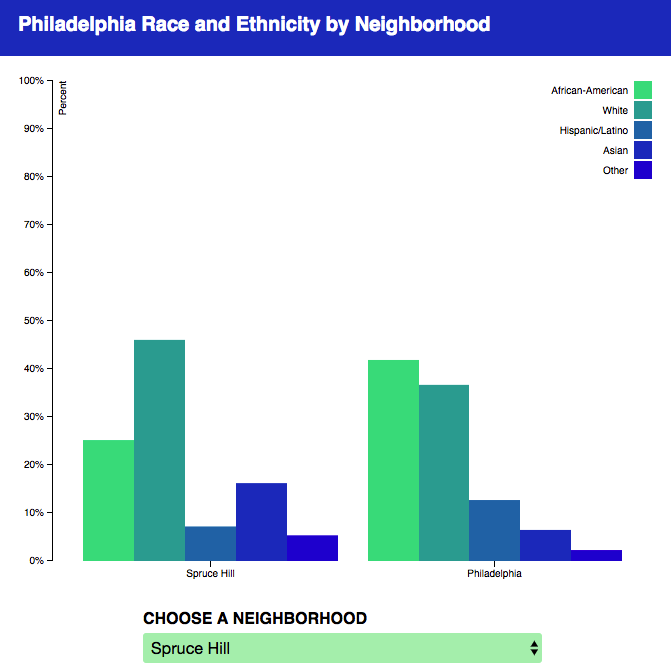
I’m currently learning d3.js and created this bar graph module to be part of a larger project that I’m working on. The user is able to look at the ratio of Philly neighborhoods’ race and ethnicity proportions in comparison to the city as a whole.